Key points:
Bitcoin (BTC) surged to a new all-time high on Thursday, and the bullish sentiment has rubbed off on select altcoins. One such altcoin is Sui (SUI), which rallied 11.3% to $3.41.
Could SUI continue its upward move? Let’s analyze the charts to find out.
SUI price prediction
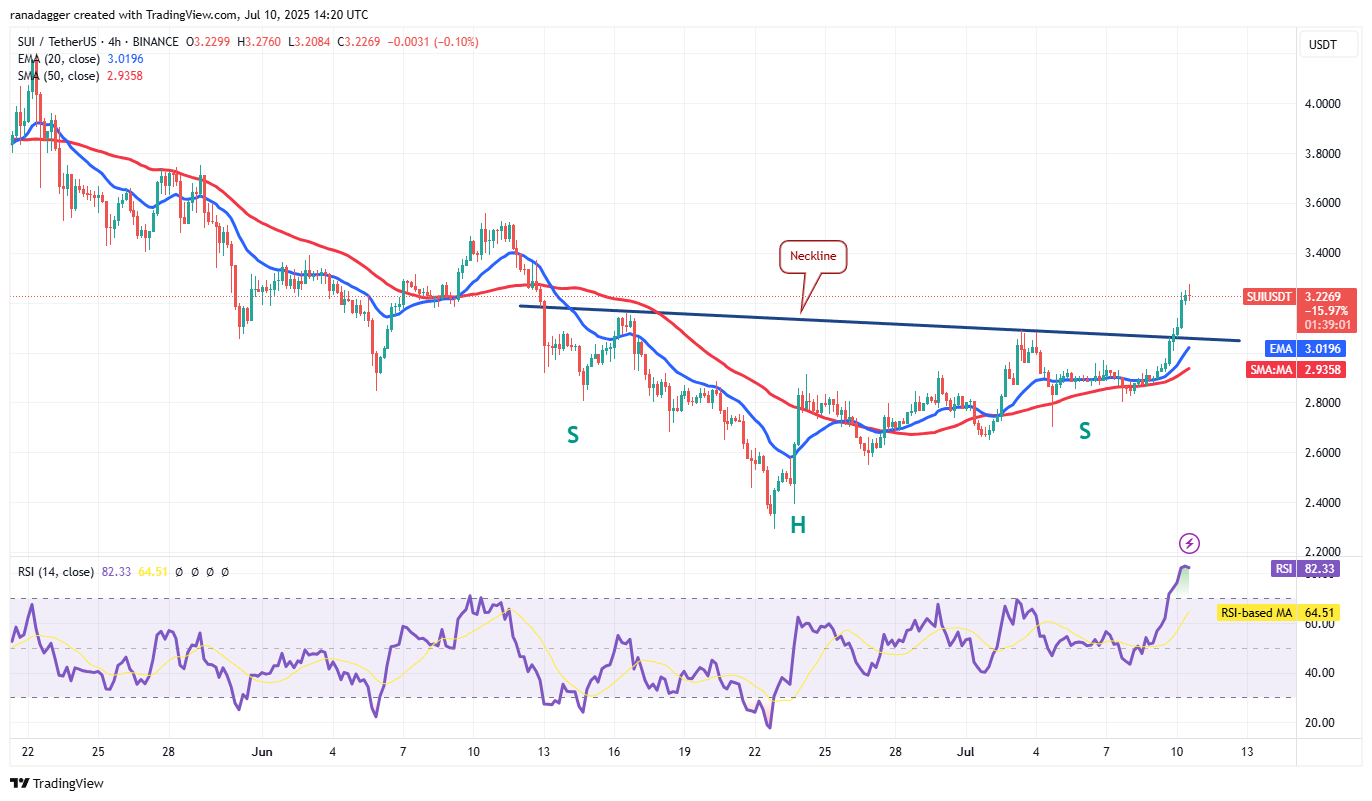
SUI turned up sharply from the 20-day exponential moving average (EMA) ($2.92) on Wednesday and broke above the 50-day simple moving average (SMA) ($3.08) on Thursday.
The 20-day EMA is trying to turn up, and the relative strength index (RSI) has jumped into positive territory, indicating that the bulls are back in the game. If buyers maintain the price above the 50-day SMA, the SUI/USDT pair could climb to $3.55.
Contrary to this assumption, if the price turns down and breaks below the 20-day EMA, it signals that the bears continue to sell on rallies. The pair could then descend to $2.64 and later to $2.29.
Related: Bit Mining surges 350% on pivot to Solana, plans $300M token treasury

The pair completed a bullish inverse head-and-shoulders pattern on a close above the $3.08 level. Although the upsloping moving averages signal an advantage to buyers, the overbought level on the RSI suggests a pullback may be around the corner. The neckline is the crucial support to watch out for on the downside. If the price rebounds off the neckline, the pair could rally to $3.50 and subsequently to the pattern target of $3.89.
This optimistic view will be negated in the near term if the price turns down and plunges below the moving averages. That may sink the pair to $2.80 and then to $2.60.
This article does not contain investment advice or recommendations. Every investment and trading move involves risk, and readers should conduct their own research when making a decision.


