
Key points:
-
Bitcoin gained 3% to above $105,000 on June 24 as Israel and Iran agreed to a ceasefire.
-
Continued capital inflow into spot Bitcoin ETFs is boosting investor confidence across the market.
-
A classic bullish pattern is in play, positioning BTC price for a rally to $144,000.
Bitcoin (BTC) is up today, rising over 3% in the last 24 hours to around $105,000 on June 24.
Data from Cointelegraph Markets Pro and TradingView shows that the BTC/USD pair climbed as much as 8% to a high of $106,100 on June 23 from a low of $98,240 on June 22.
Let’s take a look at the factors driving up Bitcoin price today.
Israel-Iran ceasefire restores risk appetite
On June 24, US President Donald Trump announced that Israel and Iran had agreed to a ceasefire, significantly boosting global risk appetite and propelling cryptocurrencies higher.

The “12-day war,” which involved Israeli and US strikes on Iranian nuclear facilities and Iranian retaliatory attacks on Israel, as well as strikes on US military bases in Qatar, had rattled markets, pushing Bitcoin below $100,000.
The ceasefire has eased fears of escalation and potential disruptions to oil supplies through the Strait of Hormuz.
As a result, investors are rotating back into risk assets, with Bitcoin’s rise to $106,000 leading recovery across the broader crypto market.
Spot Bitcoin ETF inflows boost BTC price
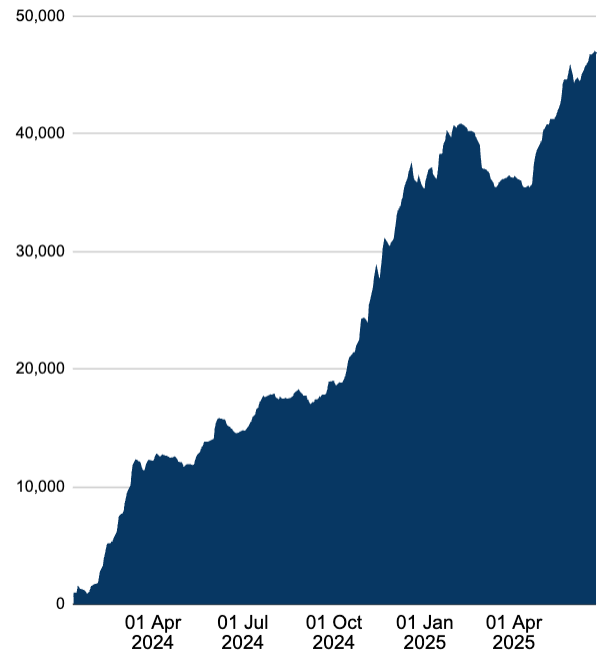
Bitcoin’s price rise today coincides with rising capital inflows into US spot Bitcoin exchange-traded funds (ETFs), highlighting the growing demand for regulated exposure to the cryptocurrency.
Spot Bitcoin ETFs have recorded inflows for 10 consecutive days, bringing the total inflows $49.9 billion since their market debut on Jan. 11, 2024, as per data from Farside Investors. Approximately $350.6 million flowed into spot Bitcoin ETFs on June 24.
Additional data from CoinShares reveals that institutional investors asserted their optimism in crypto markets as $1.24 billion flowed into crypto investment products last week, marking a 10-week streak of inflows.
Bitcoin investment products comprised $1.1 billion, indicating growing investor confidence in BTC as the leading digital asset.
More institutional demand came from corporate investors, with Strategy, formerly MicroStrategy, the top corporate Bitcoin holder, acquiring 245 BTC worth about $26 million last week. Japan’s Metaplanet has bagged another 1,111 BTC for about $118 million, per a June 23 announcement.
Metaplanet has acquired 1,111 BTC for ~$118.2 million at ~$106,408 per bitcoin and has achieved BTC Yield of 306.7% YTD 2025. As of 6/23/2025, we hold 11,111 $BTC acquired for ~$1.07 billion at ~$95,869 per bitcoin. $MTPLF pic.twitter.com/1vUdTc0Mti
— Simon Gerovich (@gerovich) June 23, 2025
With increasing institutional demand for Bitcoin, the price is expected to continue its upward trajectory toward all-time highs and into price discovery.
Bitcoin’s cup-and-handle pattern targets $144,000
From a technical perspective, the BTC/USD pair has been forming a cup-and-handle chart pattern on its daily chart since Jan. 20, positioning it for a massive move higher.
Note that BTC price now trades inside the handle range, eyeing a break above the resistance at $105,000, the 50-day simple moving average (SMA). If this happens, the price will rise to confront resistance from the pattern’s neckline at $109,000.
A decisive daily candlestick close above the neckline could lead the BTC price to confront resistance from the $112,000 all-time high reached on May 23.
Breaking this barrier would clear the path toward the technical target of the prevailing chart pattern at $144,000, up 37% from the current level.
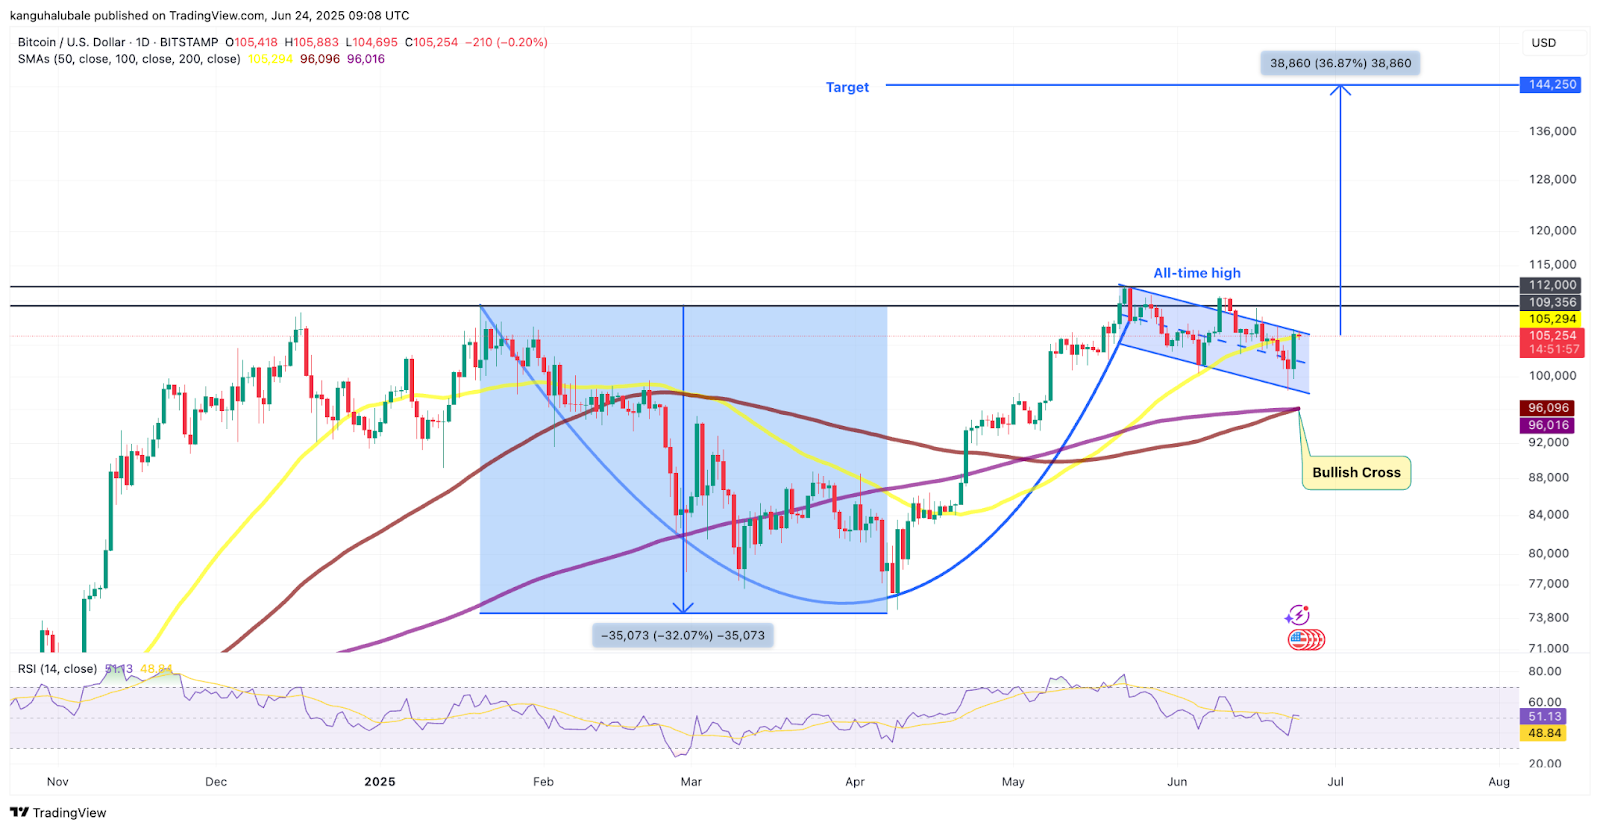
The relative strength index, or RSI, is at 69, and a “bullish cross” from the SMAs suggests that the market conditions still favor BTC’s upside.
As Cointelegraph reported, a move to new all-time highs above $112,000 would be possible by the end of this week if the resistance at the 50-day SMA ($105,000) is flipped into new support.
This article does not contain investment advice or recommendations. Every investment and trading move involves risk, and readers should conduct their own research when making a decision.