
Key point:
Ether (ETH) has been range-bound for several days, but institutional investor demand is picking up. Glassnode data shows 106,000 Ether flowing into spot Ether exchange-traded funds last week, the seventh successive week of positive flows.
However, not everyone is bullish on Ether. Etherscan shows two Ethereum wallets unstaked and withdrew 95,920 Ether early in June. A large portion of that, 62,289 Ether, has been deposited in various exchanges, potentially to be sold.
Will Ether’s range-bound action resolve to the upside or the downside? Let’s study the charts to find out.
Ether price prediction
Ether has been trading between the 50-day simple moving average ($2,528) and the horizontal support at $2,323 for the past few days.
Both moving averages have flattened out, and the relative strength index (RSI) is near the midpoint, signaling a consolidation in the near term. If buyers push the price above the 50-day SMA, the ETH/USDT pair could climb to $2,738 and later to $2,879. Sellers are expected to fiercely defend the $2,879 level.
Instead, if the price turns down from the 50-day SMA, the bears will try to pull the pair below the $2,323 support. If they manage to do that, the pair could plunge to solid support at $2,111. The next trending move could begin above $2,879 or below $2,111.
Related: Bitcoin traders adopt ‘defensive stance’ as 15-day ETF inflow streak ends
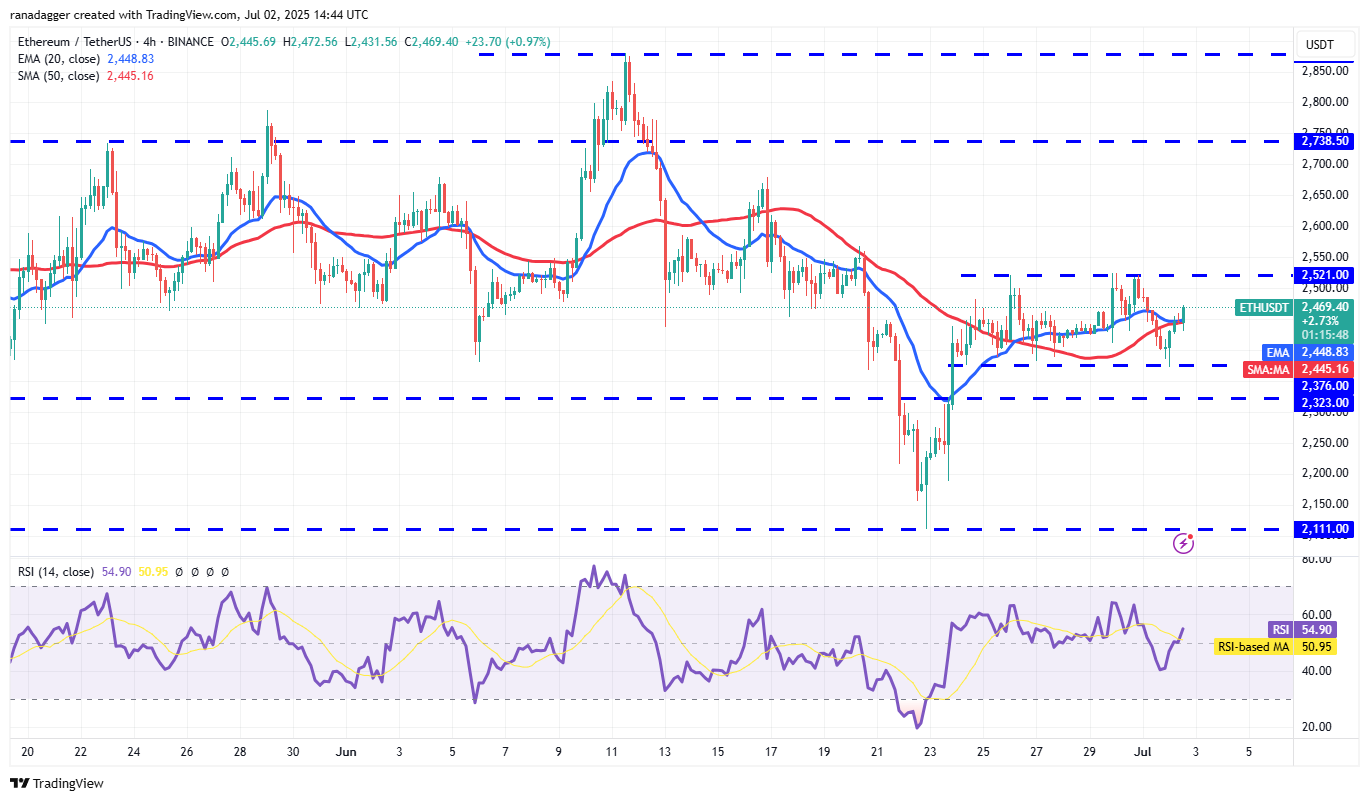
The pair has been stuck between $2,376 and $2,521 for some time. The flattening moving averages and the RSI just above the midpoint do not give a clear advantage either to the bulls or the bears.
If the price sustains above the moving averages, the pair could reach the $2,521 level. Sellers will try to halt the rally at $2,521, but if the bulls prevail, the pair could surge to $2,666.
Contrarily, if the price turns down sharply from $2,521, the pair may extend its stay inside the range for a while longer.
This article does not contain investment advice or recommendations. Every investment and trading move involves risk, and readers should conduct their own research when making a decision.