
Key point:
BNB Smart Chain’s Maxwell upgrade, which, according to the BNB Chain team, is “a technical leap forward for faster blocks, better validator coordination, and smoother network performance,” went live on Monday.
How has BNB’s (BNB) price responded to the latest upgrade? Could buyers propel the price above the overhead resistance? Let’s analyze the charts to find out.
BNB price prediction
BNB broke above the descending channel pattern on Sunday, and the bulls successfully defended the retest of the breakout level on Tuesday. That suggests the bulls have flipped the resistance line into support.
The 20-day exponential moving average ($648) is flattish, but the relative strength index (RSI) is just above the midpoint, indicating a slight momentum in favor of the bulls. If buyers sustain the price above $660, the BNB/USDT pair could climb to $675 and later to $698. Sellers are expected to fiercely defend the $698 resistance because a break above it opens the gates for a rally to $732.
Time is running out for the bears. They will have to swiftly pull the price back into the channel to make a comeback. That could sink the pair to $625.
Related: Bitcoin squeezes shorts in $108K spike as US jobs drop most in 2 years
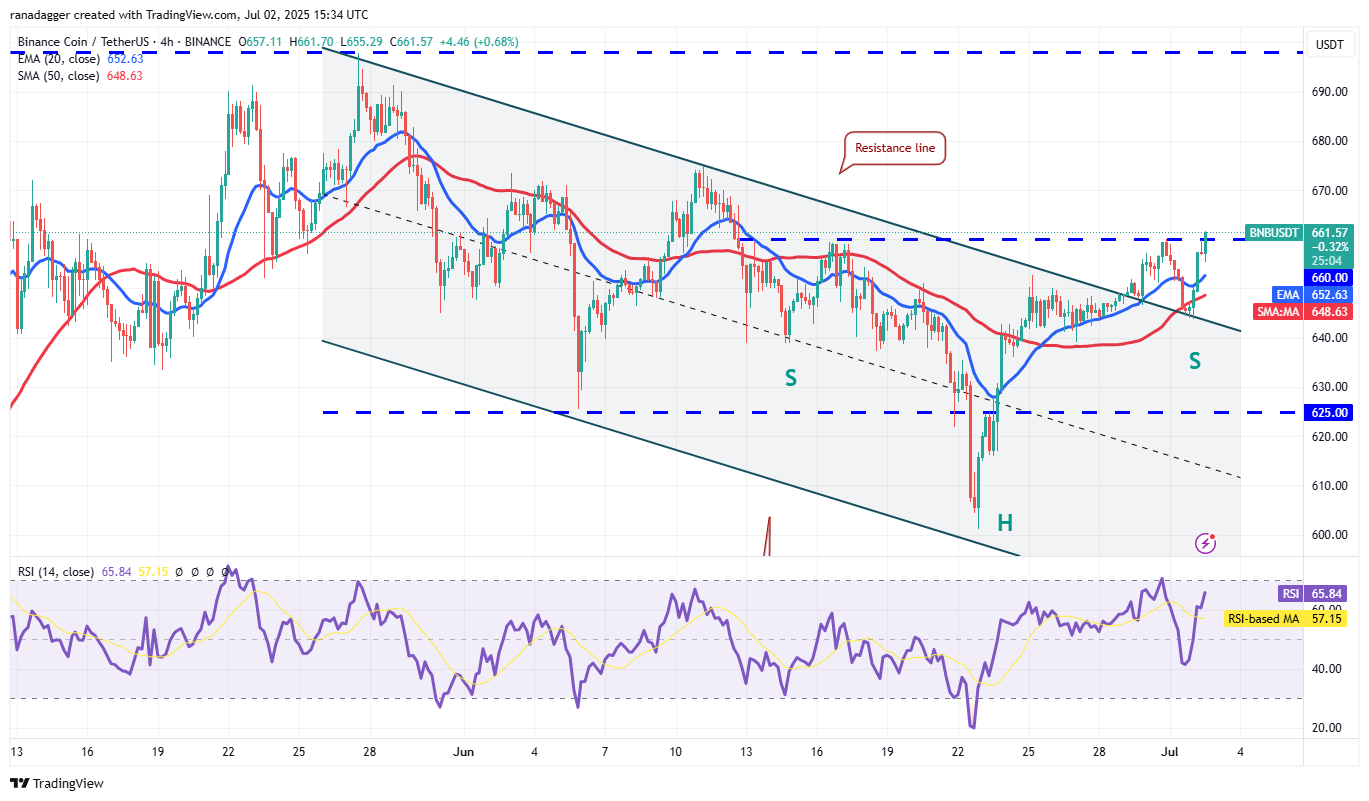
The 4-hour chart shows the price rebounded sharply off the resistance line, indicating solid demand at lower levels. The pair will complete a bullish inverse head-and-shoulders pattern if the price closes above $660. This bullish setup has a pattern target of $719.
The moving averages are likely to act as support on any pullback. The first sign of weakness will be a break and close below $643. That suggests the bulls have given up. The pair may then tumble to $636.
This article does not contain investment advice or recommendations. Every investment and trading move involves risk, and readers should conduct their own research when making a decision.


